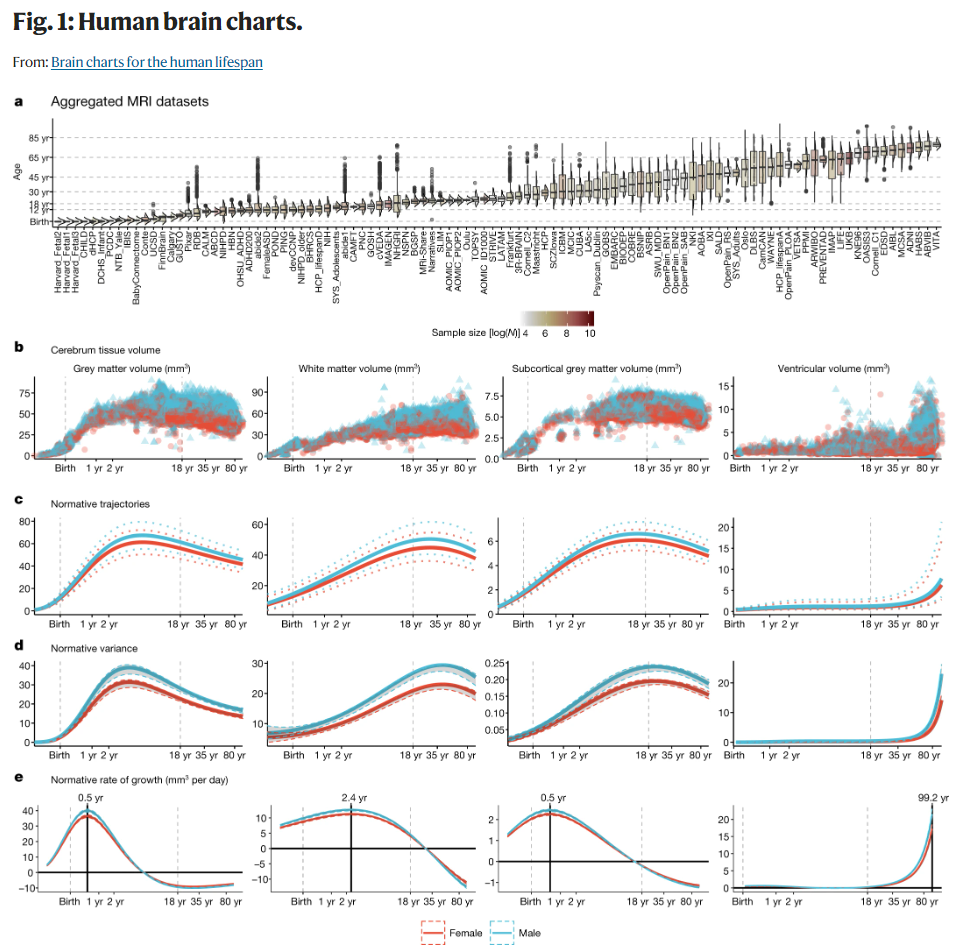
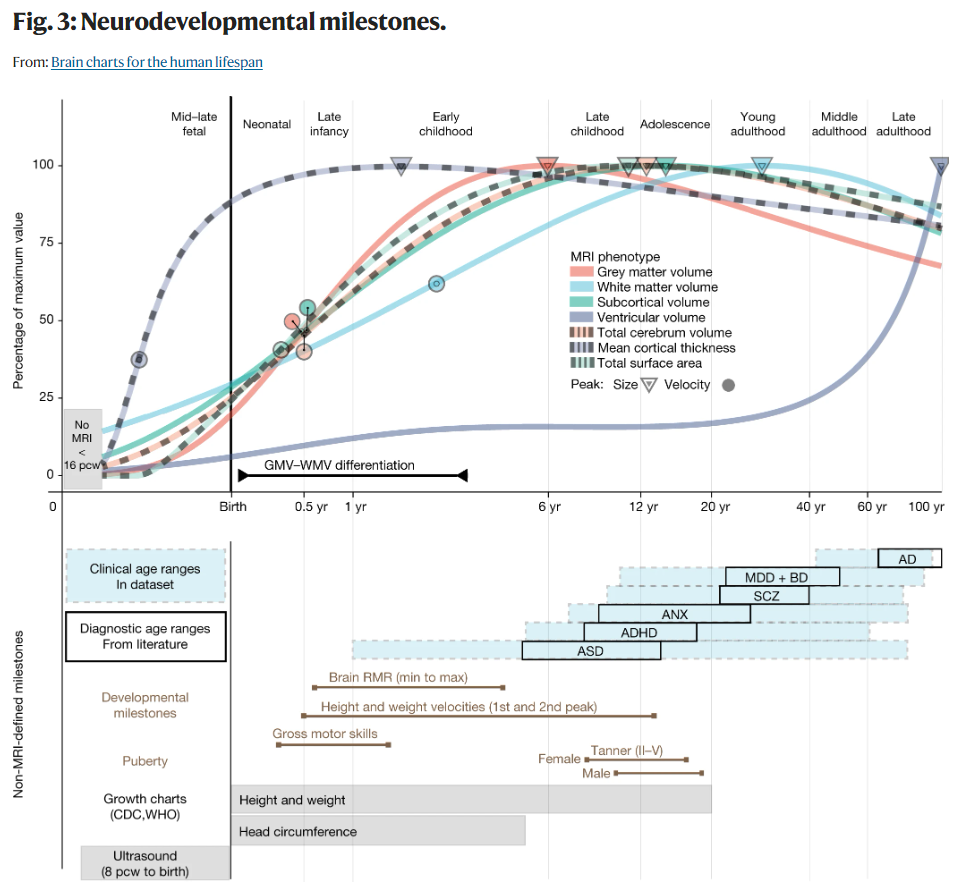
a, MRI data were aggregated from over 100 primary studies comprising 123,984 scans that collectively spanned the age range from mid-gestation to 100 postnatal years. Box–violin plots show the age distribution for each study coloured by its relative sample size (log-scaled using the natural logarithm for visualization purposes). b, Non-centiled, ‘raw’ bilateral cerebrum tissue volumes for grey matter, white matter, subcortical grey matter and ventricles are plotted for each cross-sectional control scan as a function of age (log-scaled); points are coloured by sex. c, Normative brain-volume trajectories were estimated using GAMLSS, accounting for site- and study-specific batch effects, and stratified by sex (female, red; male, blue). All four cerebrum tissue volumes demonstrated distinct, non-linear trajectories of their medians (with 2.5% and 97.5% centiles denoted as dotted lines) as a function of age over the lifespan. Demographics for each cross-sectional sample of healthy controls included in the reference dataset for normative GAMLSS modelling of each MRI phenotype are detailed in Supplementary Table 1.2–1.8. d, Trajectories of median between-subject variability and 95% confidence intervals for four cerebrum tissue volumes were estimated by sex-stratified bootstrapping (see Supplementary Information 3 for details). e, Rates of volumetric change across the lifespan for each tissue volume, stratified by sex, were estimated by the first derivatives of the median volumetric trajectories. For solid (parenchymal) tissue volumes, the horizontal line (y = 0) indicates when the volume at which each tissue stops growing and starts shrinking and the solid vertical line indicates the age of maximum growth of each tissue. See Supplementary Table 2.1 for all neurodevelopmental milestones and their confidence intervals. Note that y axes in b–e are scaled in units of 10,000 mm3 (10 ml).Top, a graphical summary of the normative trajectories of the median (50th centile) for each global MRI phenotype, and key developmental milestones, as a function of age (log-scaled). Circles depict the peak rate of growth milestones for each phenotype (defined by the maxima of the first derivatives of the median trajectories (Fig. 1e)). Triangles depict the peak volume of each phenotype (defined by the maxima of the median trajectories); the definition of GMV:WMV differentiation is detailed in Supplementary Information 9.1. Bottom, a graphical summary of additional MRI and non-MRI developmental stages and milestones. From top to bottom: blue shaded boxes denote the age range of incidence for each of the major clinical disorders represented in the MRI dataset; black boxes denote the age at which these conditions are generally diagnosed as derived from literature73 (Methods); brown lines represent the normative intervals for developmental milestones derived from non-MRI data, based on previous literature and averaged across males and females (Methods); grey bars depict age ranges for existing (World Health Organization (WHO) and Centers for Disease Control and Prevention (CDC)) growth charts of anthropometric and ultrasonographic variables24. Across both panels, light grey vertical lines delimit lifespan epochs (labelled above the top panel) previously defined by neurobiological criteria63. Tanner refers to the Tanner scale of physical development. AD, Alzheimer’s disease; ADHD, attention deficit hyperactivity disorder; ASD, autism spectrum disorder (including high-risk individuals with confirmed diagnosis at a later age); ANX, anxiety or phobic disorders; BD, bipolar disorder; MDD, major depressive disorder; RMR, resting metabolic rate; SCZ, schizophrenia.
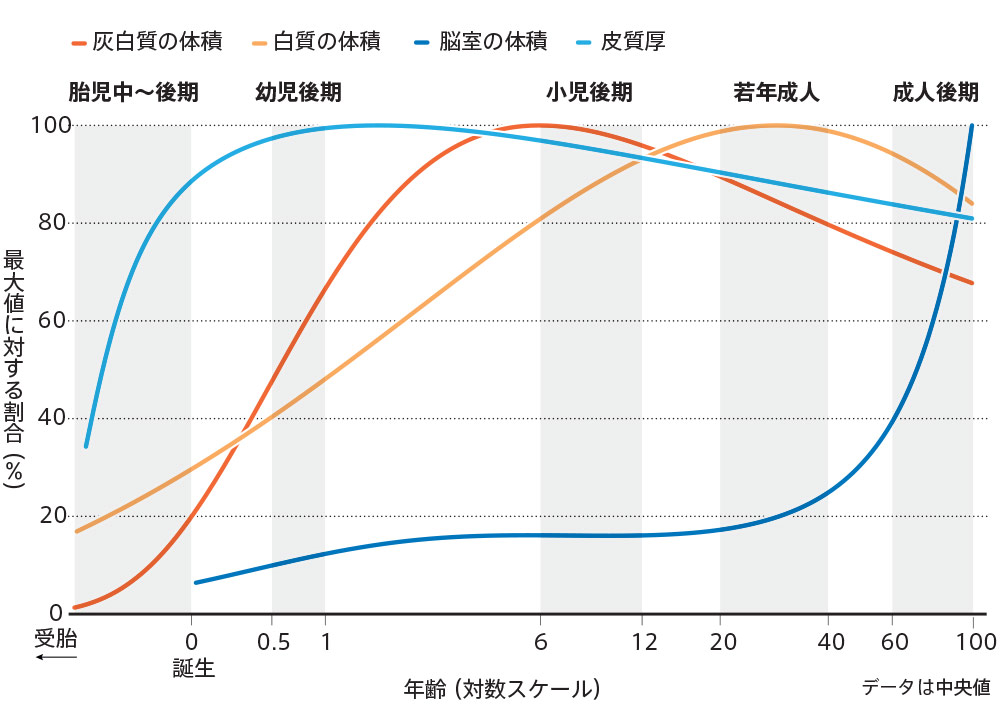
脳の変化 研究者たちは、12万以上の脳スキャン画像を分析して、これまでで最も包括的な脳の成長曲線を作り上げた。白質と灰白質の体積と平均皮質厚(灰白質の幅)は発達の初期に急速に増加するが、脳室の体積(脳内の脳脊髄液の量)は人生の後半に急速に増加する。 | 拡大するR. A. I. BETHLEHEM ET AL. NATURE HTTPS://DOI.ORG/HPKN (2022)